
By Amir BENYEKKOU – Systems Engineer, Virtual Infrastructure at Squad
This second article addresses issues related to a VMware vSphere environment where over-allocation of resources can lead to performance degradation of virtualized workloads. Only troubleshooting related to ESXi hypervisors will be covered. Performance issues related to the configuration of VMware vSphere cluster and HA features will not be addressed here.
For each CPU, memory, network, and storage component, there are specific counters that can be monitored to reveal any lack of optimization in the virtualized infrastructure. These counters can be monitored using the graphical client built into the web console for a capacity management approach, or via the command line for a troubleshooting-oriented approach.
To get the best performance from an environment, two practices must be followed:
- Understanding application requirements and workload characteristics
- Optimize VM configuration to provide the best environment for workloads.
Troubleshooting Diagram
The following diagram shows the basic troubleshooting process for an ESXi host. The checklist covers most performance issues on an ESXi:
- Direct problems: problems that have a direct effect and must be corrected.
- Common problems: conditions that have a direct effect on performance most of the time
- Possible problems: conditions that may be indicators but may also reflect normal operating conditions.
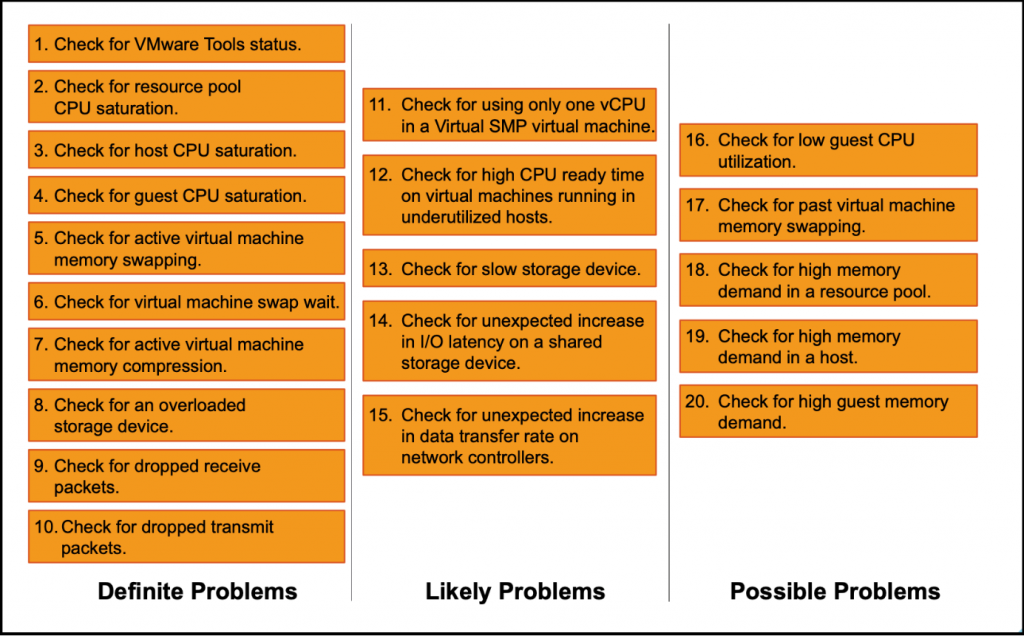
All of these issues can be identified using the VMware vSphere monitoring client or with the esxtop command-line utility on vCenter or ESXi hosts.
Network Performance Troubleshooting
The esxtop tool and other tools can be used to view the network status at a given moment on both the ESXi host's vSwitches and the virtual machines' virtual network cards.
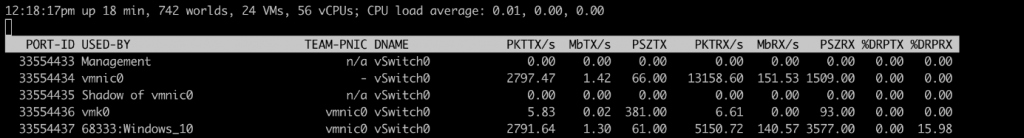
The indicators to be displayed can be configured. The two most significant indicators are ignored packets during transmission/reception (%DRPTX & %DRPRX).
If the packet drop rate on reception is > 0:
- The cause may be intensive CPU usage within the VM. In this case, you must either increase the CPU resources allocated to the VM or improve the VM's CPU resource usage efficiency.
- Or an incorrect configuration of the VM's network drivers, requiring improved network stack support or network load balancing.
If the packet drop rate during transmission is > 0:
- Traffic from virtual machines connected to the same vSwitch exceeds the physical capacity of the uplink cards or the underlying physical network infrastructure. In this case, you must add uplinks to the vSwitch, balance the network load of the virtual machines by moving them to other vSwitches, improve the capacity of the physical network, or reduce network traffic.
The information collected should also be checked against that of the underlying physical network.
If the data transfer rate increases very quickly (MBTX/s or MBRX/s):
Network resources are in contention because several features share the same physical link (vMotion or Fault Tolerance, for example). In this case, set up sharing, reservations, and limits with Network IO Control to distribute traffic among the different types of network flows.
Troubleshooting Storage Performance
Several indicators will need to be taken into account with esxtop, and these indicators will need to be compared on three levels: physical storage adapter (HBA card), physical storage device (LUN), and virtual machine virtual disk.
The key indicators to be analyzed will be:
- The throughput of the disks
- Kernel and device latency
- Number of failed, active, and queued disk commands.
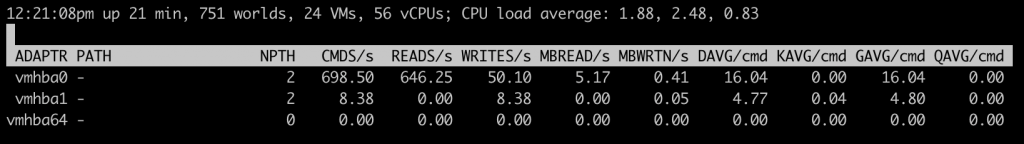
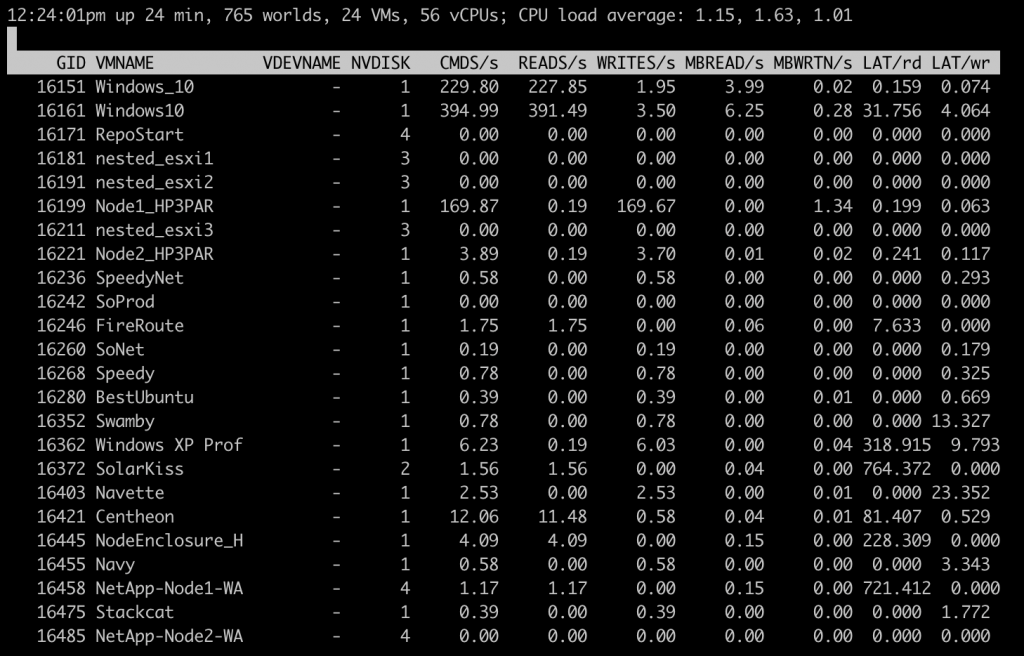
The sum of Reads/s and Writes/s is equal to IOPS and allows you to check whether IOPS are at the limit of the underlying storage.
On the HBA card view:
The DAVG/cmd and KAVG/cmd indicators represent the average latency in milliseconds for the device and VMKernel, respectively.
The first indicator corresponds to the average time taken by a physical device to complete a SCSI command. This metric defines the time taken by the physical device from the HBA card to the underlying storage system.
The second corresponds to the average time taken by the VMKernel to process a SCSI command. This metric measures the time between the VM's OS and its virtual device.
If the first indicator is > 20, then the LUN is slow or overloaded; if it is between 10 and 20, this may represent a potential performance issue.
If the second indicator is > 2 ms, then the VMs are attempting to send more throughput than the underlying storage can handle.
The total latency of a VM is the sum of device latency (DAVG) and VMkernel latency (KAVG). If the indicator is > 10, there may be a problem, and if it is > 20, there is a performance issue.
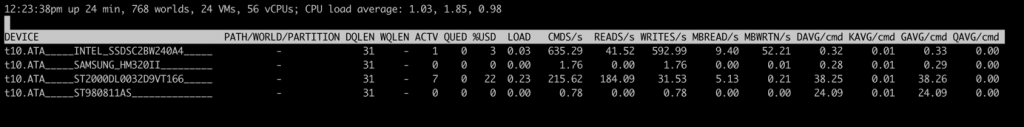
On the LUN view:
The number of active and queued commands (ACTV & QUED) on the LUNs can highlight potential LUN contention. If the number of active commands reaches the maximum queue depth (DQLEN), the commands will be placed in a queue, resulting in increased latency.
The number of failed commands (ABRT/s) on the LUNs allows you to see if any of them are overloaded. In this case, you will need to check that the RAID level, cache, and number of disks per LUN are configured to meet the workload requirements.
Vsphere Storage IO Control allows for more granular control over allocations per VM in order to reduce contention on storage resources.
Finally, the VM view provides a more detailed view of the VMs and allows you to trace a performance issue from start to finish.
Troubleshooting Processor Performance
The indicators related to processor performance are similar to those found on traditional Linux systems, with a few specific features related to virtualization and virtual machines.
The key indicators are:
- CPU used on the ESXi host
- CPU used by VM
- CPU Ready per VM
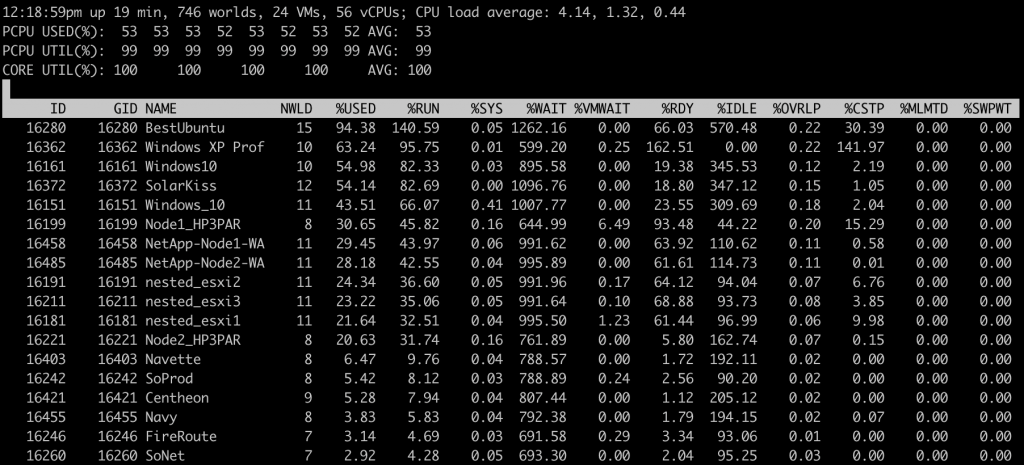
The most important esxtop indicators are:
- %PCPU Used = Percentage of usage per physical CPU
- %USED: Percentage of CPU usage per VM
- %SYS: Percentage of time spent by the VMKernel managing interrupts
- %RDY: Percentage of time a VM was ready to execute instructions but no physical CPU resources were allocated.
- %WAIT: Percentage of time spent in the busy or blocked state by a VM
High CPU usage values do not necessarily indicate a performance issue, as this is one of the goals of virtualized environments. However, when correlated with high network queue values, this may indicate a potential problem.
The "ReadyTime" indicator shows whether there are more CPU resources requesting to be scheduled on the host's physical CPUs. These requests are queued by the host's CPU scheduler because the physical CPUs are already overloaded.
If this indicator is > 10%, the VM's workload should be analyzed:
- Follow best practices for application configuration on the VM
- Choosing the right number of CPUs for the VM
- Use large memory pages
- Adjust VM limits, reservations, and memory
- Increase the CPU allocation on the VM if the guest OS and its applications are consuming all CPU resources.
But also check that there is no over-allocation of vCPUs relative to the physical CPUs on the host.
Troubleshooting Memory Performance
The techniques described in the first article can be highlighted by the various esxtop indicators.
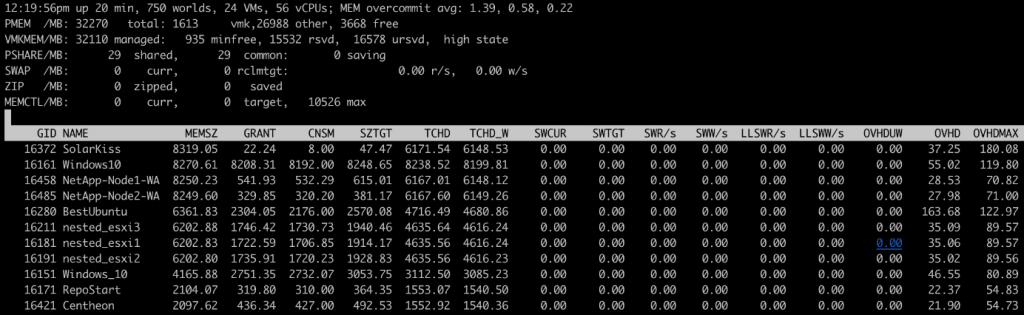
Several key indicators should be monitored:
- PMEM: ESXi physical memory, the sum of vmk, other, and free gives the total physical memory.
- VMKMEM: Total memory managed by the VMKernel, the sum of reserved, unreserved, and vmkernel memory on the PMEM line. As well as the state (here high state). The lower the state, the more memory optimization techniques have been executed.
- PSHARE: Memory statistics after Transparent Sharing has been enabled
- SWAP: Total memory paged by virtual machines with SWR/s and SWW/s (read/write throughput in MB for each VM)
- ZIP: Compressed memory size by the ESXi host
- SWCUR: The amount of swap space used by the VM.
- SWTGT: The amount of swap space that the ESX host expects to be used by the VM.
- MEMCTL: Ballooning statistics (memory reclamation to other VMSs in case of contention)
- MEMCTL?: Indicates whether vmtools are installed on each VM or not in order to enable ballooning.
- MCTLSZ: Memory claimed by ballooning on each VM
The states displayed on the console (high state, clear, soft, hard, low) will help guide the diagnosis and understand that as the overall state deteriorates, memory-saving techniques will be used one after the other. These states are reached either by memory over-allocation or by too many VMs on the host.
In this case, the VMs can be migrated and, to ensure a sustainable solution, the memory consumption of each VM can be measured in order to redefine the allocation or limits/reservations on the VMs.
Article to reread:
VMWare Vsphere: Performance optimization
